Most developers check the same things every morning — open PRs, CI build status, deployment health, Jira tickets, and maybe a few RSS feeds. A personal developer dashboard pulls these into one view so you start the day knowing exactly what needs attention.
This guide walks through building a practical dashboard using tools that require minimal maintenance.
What Belongs on a Developer Dashboard
The goal is a single-glance overview of your work context. Include only what you check daily; anything else is clutter. For most developers, this means: active PRs and review requests, CI/CD pipeline status, deployment health and recent deploys, current sprint tasks or active tickets, and team communication highlights.
If you are already tracking your tools with a productivity toolkit, the dashboard becomes the unified view of those tools.
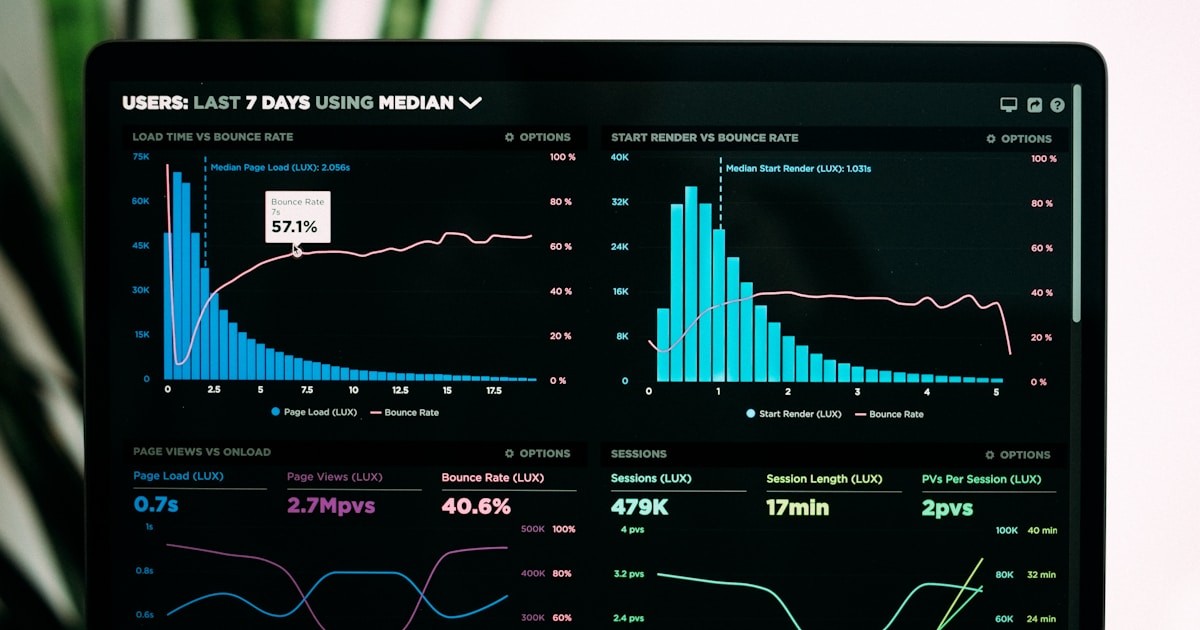
Option 1: Grafana Dashboard
If your team already runs Grafana for log management or monitoring, building a developer dashboard on top of it is natural. Grafana connects to virtually any data source and the dashboard builder is flexible.
Connect GitHub (via the GitHub data source plugin) for PR metrics and CI status. Connect your Kubernetes cluster for deployment health. Add Prometheus queries for service uptime and error rates. Use the JSON API data source for any tool with a REST API — Jira, Linear, Notion, or your project management tool.
The advantage is that Grafana is already battle-tested for dashboards. Alerts, auto-refresh, and mobile access are built in. The downside is setup time — each data source requires configuration, and the query language varies by source.
Option 2: Dashy or Homepage
Dashy and Homepage are self-hosted dashboard apps designed for exactly this use case. They provide a widget-based layout where you configure tiles for different services.
Homepage has built-in widgets for Docker, Kubernetes, Portainer, Sonarr, Radarr, and dozens of other services. It also supports custom API widgets where you point it at any URL and define how to display the response. The YAML configuration is straightforward and lives in a config file you version control.
Dashy offers more customization — themes, layouts, icons, and interactive widgets. It supports authentication, so you can host it for your team without exposing it publicly. Both run as Docker containers and are lightweight enough for a Raspberry Pi or a small VPS.
Option 3: CLI Dashboard with wtfutil
For terminal-native developers, wtfutil runs a dashboard in your terminal. It shows Git repos, GitHub PRs, Jira tickets, OpsGenie alerts, Todoist tasks, and more in a configurable terminal layout.
The configuration is YAML-based and each module connects to a service API. The result is a persistent terminal window that updates in real time — glance at it between tasks to see if anything needs attention. Pairs well with AI-powered terminal tools and tmux workflows.
What to Display
PR Overview: Your open PRs, PRs awaiting your review, and recently merged PRs. Include CI status for each. If AI code review tools are in your workflow, include their status too.
CI/CD Status: Current build status for main branches, recent deployment history, and any failed pipelines. Link directly to the CI/CD platform for details.
Service Health: Uptime status, error rate trends, and recent alerts for services you own. Pull from your monitoring stack (Prometheus, Datadog, or whatever you use).
Sprint Progress: Current tickets assigned to you, their status, and sprint burndown. Connect to your project management tool.
Recent Deploys: What went to production recently, who deployed it, and whether it is healthy. This context prevents the “wait, when did that change ship?” question.
Keeping It Maintained
The biggest risk with a personal dashboard is abandonment. Start simple — three or four widgets that cover your most-checked services. Add more only when you find yourself repeatedly checking something that is not on the dashboard.
Automate updates. Every widget should refresh automatically. If you have to manually trigger updates, you will stop using it within a week.
Version control the configuration. Whether it is Grafana JSON, Homepage YAML, or wtfutil config, keep it in a repository. This makes it reproducible if you switch machines and shareable with teammates who want the same setup.
Verdict
Grafana is the best for teams already using it for monitoring. The data source flexibility is unmatched.
Homepage is the best standalone option for a self-hosted developer dashboard. The built-in widgets cover most needs with minimal configuration.
wtfutil is the best for terminal workflows. If your entire development environment lives in the terminal, the dashboard should too.
Start with the tool that matches your existing workflow. The value is in the habit, not the technology — check the dashboard every morning and let it surface what matters.
About Brian Detering
Brian Detering is a software engineer, educator, and tech writer based in Los Angeles. He teaches programming and software engineering at the University of Southern California, where his work spans programming languages, systems architecture, and applied AI. With over a decade of hands-on experience building production systems, Brian writes about the tools and workflows that actually make developers more productive — from CI/CD pipelines and containerization to API testing and security best practices. When he's not teaching or writing code, he's usually benchmarking the latest dev tools or tinkering with homelab infrastructure.