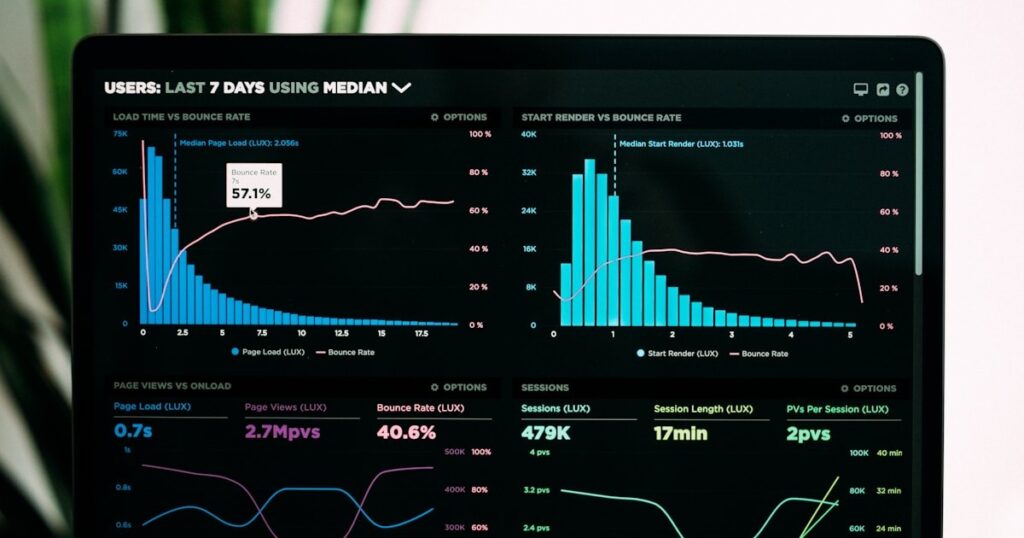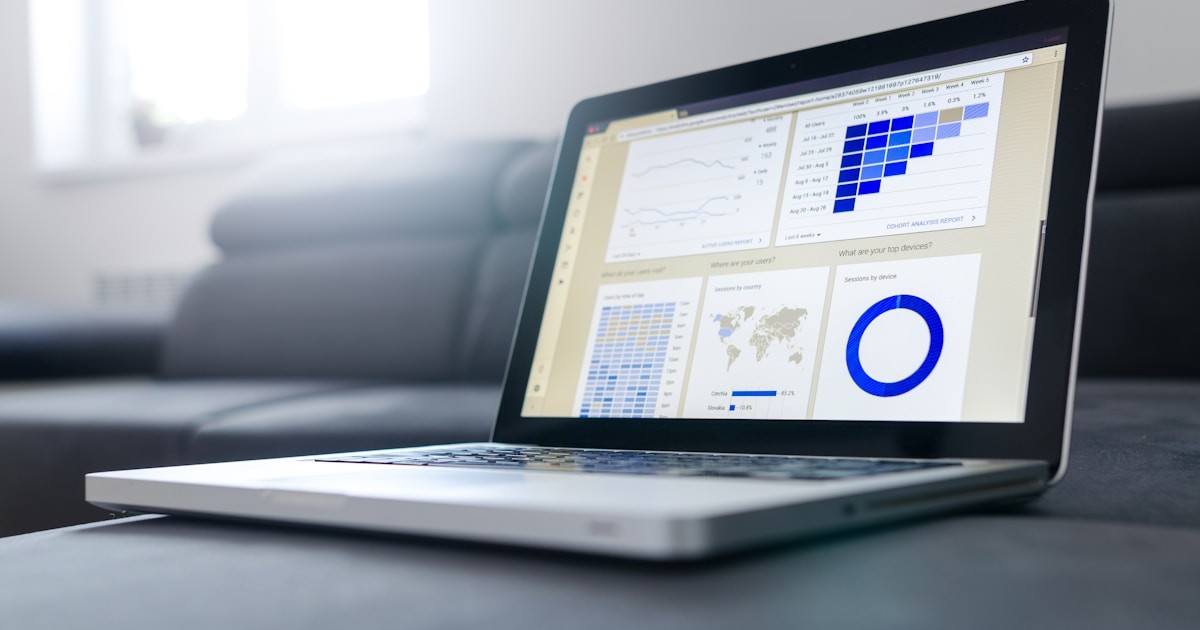
Monitoring tells you when something is wrong before your users do. The right monitoring stack provides metrics (what is happening), alerts (when to pay attention), and dashboards (how to understand the big picture). I compared Prometheus, New Relic, and Uptrace for development teams running production services.
Prometheus + Grafana (Open Source)
Prometheus is the standard for metrics collection in cloud-native environments. It scrapes metrics endpoints on a schedule, stores time-series data, and provides PromQL for querying. Combined with Grafana for dashboards and Alertmanager for notifications, it forms a complete open-source monitoring stack.
For Kubernetes clusters, Prometheus is the natural choice. The kube-prometheus-stack Helm chart installs Prometheus, Grafana, and pre-built dashboards for cluster health, node resources, and pod metrics in one command.
PromQL has a learning curve but is powerful. Queries like “99th percentile response time for the API service over the last hour, grouped by endpoint” are one line. Once you are comfortable with PromQL, ad-hoc investigation during incidents is fast.
The trade-off is operational overhead. Self-hosted Prometheus requires storage management, retention configuration, and scaling considerations. For high-cardinality metrics, Prometheus can consume significant resources. Thanos or Cortex add long-term storage and horizontal scaling but increase complexity.
Grafana Cloud offers managed Prometheus with a generous free tier (10,000 metrics series). This eliminates the operational burden while keeping the PromQL query experience. Combined with Grafana Loki for logs, the full Grafana stack provides unified observability.
Best for
Teams running Kubernetes or cloud-native infrastructure. Organizations that prefer open-source tools with community support. Budget-conscious teams that can handle the operational investment.
New Relic
New Relic is a full-platform observability solution — APM, infrastructure monitoring, logs, browser monitoring, synthetic checks, and error tracking in one platform. The unified experience means clicking from a dashboard metric to the specific transaction trace to the error log happens in one interface.
The APM auto-instrumentation is New Relic’s biggest time-saver. Install the agent in your Node.js, Python, Java, or Go application, and it captures transaction traces, database queries, external calls, and error rates without code changes. Within minutes of deployment, you have visibility into application performance.
NRQL (New Relic Query Language) is SQL-like and approachable. Developers who know SQL can write monitoring queries immediately. Dashboards are built from NRQL queries, and alerts use the same syntax for conditions.
The free tier is substantial: 100GB of data ingest per month, one full-platform user, and unlimited basic users. For small teams, this covers real monitoring needs without cost. Beyond the free tier, pricing is based on data volume and user count.
Best for
Teams that want full-stack observability without assembling multiple tools. Startups that need monitoring fast with the generous free tier. Applications where APM auto-instrumentation saves significant setup time.
Uptrace
Uptrace is an open-source APM built on OpenTelemetry. It accepts traces, metrics, and logs through the OpenTelemetry Protocol (OTLP), which means any application instrumented with OpenTelemetry SDKs works with Uptrace automatically.
The OpenTelemetry-native approach is Uptrace’s strategic advantage. OpenTelemetry is becoming the standard for observability instrumentation, supported by every major cloud provider and observability vendor. Instrumenting with OpenTelemetry means you can switch between Uptrace, Jaeger, Datadog, or any other OTLP-compatible backend without changing application code.
The self-hosted version runs as a single binary with ClickHouse for storage. Performance is excellent — ClickHouse handles time-series data efficiently, and Uptrace’s query engine is fast even on large trace datasets. The resource requirements are modest compared to running the full ELK or Prometheus stack.
The cloud version provides a managed experience with a free tier. For teams that want OpenTelemetry-based monitoring without operational overhead, it is a practical option.
The limitation is ecosystem maturity. Uptrace is newer and smaller than Prometheus or New Relic. Pre-built dashboards, community integrations, and documentation are growing but less comprehensive.
Best for
Teams committed to OpenTelemetry who want a lightweight, open-source backend. Organizations that want vendor flexibility in their observability stack. Teams that need distributed tracing as a primary capability alongside secure infrastructure management.
Verdict
Prometheus + Grafana is the best for Kubernetes-native teams and organizations that prefer open-source infrastructure. The ecosystem is massive and battle-tested.
New Relic is the best for teams that want full-stack observability with minimal setup. The free tier and auto-instrumentation make it the fastest path to production monitoring.
Uptrace is the best for OpenTelemetry-native teams that want a lightweight, self-hosted backend. The ClickHouse-based storage handles scale well without the complexity of Prometheus at scale.
Start with whatever gets you monitoring fastest. Unmonitored production services are the real risk — any of these tools eliminates that blind spot.

About Brian Detering
Brian Detering is a software engineer, educator, and tech writer based in Los Angeles. He teaches programming and software engineering at the University of Southern California, where his work spans programming languages, systems architecture, and applied AI. With over a decade of hands-on experience building production systems, Brian writes about the tools and workflows that actually make developers more productive — from CI/CD pipelines and containerization to API testing and security best practices. When he's not teaching or writing code, he's usually benchmarking the latest dev tools or tinkering with homelab infrastructure.